The high protein diet has played a staple role in bodybuilding for several decades, helping individuals add more muscle while also increasing fat loss.
While these benefits are nothing new, there continued to be a lack of research assessing the use and potential benefits of a super high protein diet, which resembled the daily intake of many bodybuilders. However, in the last 2 years that has started to change, with well-known sports nutrition researcher, Dr. Antonio, investigating this and finding some impressive results.
Here’s a review of the research, benefits and practical application for your own or your clients’ diets.
Study 1
The first study conducted by Dr. Antonio investigated a group of resistance-trained males, who participated in 2 x 8 week trials. They consumed their normal protein intake first, followed by a high protein intake ( > 3 g/kg/day; equal to about 200 – 250g of protein a day). During this trial, all participants tracked their intake on MyFitnessPal while using scoops of whey protein to increase their total daily protein intake [1].
Body composition measurements were also tracked with Bod Pod®. Participants were not placed on a specific training regime and just directed to follow their regular routines and stay consistent throughout both trials.
Interestingly, the high protein diet group consumed around 400 more calories per day with carbs and fat being standardized between both groups (meaning the extra calories were all obtained from protein).
Here’s an overview of the two different diets:
| Baseline | Normal Protein | High Protein | |
|---|---|---|---|
| Kcal | 2453 ± 352 | 2534 ± 343 | 2903 ± 415*# |
| CHO g | 226 ± 81 | 220 ± 65 | 219 ± 78 |
| PRO g | 190 ± 76 | 212 ± 65 | 271 ± 61*# |
| Fat g | 80 ± 27 | 86 ± 28 | 88 ± 16 |
| Kcal/kg/day | 30.4 ± 7.3 | 31.6 ± 7.5 | 35.0 ± 4.6* |
| CHO g/kg/day | 2.7 ± 1.0 | 2.6 ± 1.0 | 2.7 ± 1.0 |
| PRO g/kg/day | 2.3 ± 1.0 | 2.6 ± 0.8 | 3.3 ± 0.8*# |
| Fat g/kg/day | 1.0 ± 0.4 | 1.1 ± 0.4 | 1.0 ± 0.2 |
| Cholesterol mg/day | 542 ± 359 | 464 ± 285 | 780 ± 566 |
| Sodium mg/day | 2892 ± 1125 | 3175 ± 971 | 3484 ± 766 |
| Sugar g/day | 49 ± 33 | 50 ± 27 | 63 ± 21 |
| Fiber g/day | 27 ± 16 | 27 ± 18 | 30 ± 12 |
After both 8 week trials, post measurements were taken again to assess changes in body composition and weight training bench press performance.
| Baseline | Normal Protein | High Protein | |
|---|---|---|---|
| Weight kg | 85.24 ± 10.83 | 84.43 ± 10.58 | 83.98 ± 10.63 |
| Fat Mass kg | 12.07 ± 3.23 | 12.04 ± 3.36 | 10.97 ± 2.89 |
| Fat Free Mass kg | 73.17 ± 9.83 | 72.39 ± 8.50 | 73.00 ± 9.93 |
| % Body Fat | 14.19 ± 3.32 | 14.15 ± 2.80 | 13.13 ± 2.98 |
| Bench Press 1-RM kgᵇ | 126.4 ± 13.9 | 119.2 ± 17.7 | 122.3 ± 13.1 |
| RTF at 60% 1-RM BPᵇ | 19.9 ± 3.2 | 21.3 ± 5.5 | 21.9 ± 3.0 |
| Volume Load kgᵃ | 48,783 ± 19,506 | 50,578 ± 18,881 | 48,989 ± 15,388 |
Probably one of the most interesting results (shown in the above tables) is that the high protein group dropped about 7% of their total fat mass, while eating around 400 more calories per day. Apart from that, total fat free mass (muscle mass) and bench press performance remained fairly similar between groups.
It’s also important to remember that these 2 groups were both high protein, compared to the context of a regular individual’s daily intake. After all, the ‘normal protein’ group consumed around 212 grams of protein per day (2.6 g/kg/bw) which is still probably higher than that of a lot of people reading this.
Study 2
A follow-up study was then conducted where participants were also placed on a well-controlled and heavy, periodized resistance training plan. In a similar fashion to above, participants were split into ‘normal’ protein at 2.3 g/kg/day (which would still be high in comparison to an average person’s intake) and ‘high’ at 3.4 g/kg/day [2].
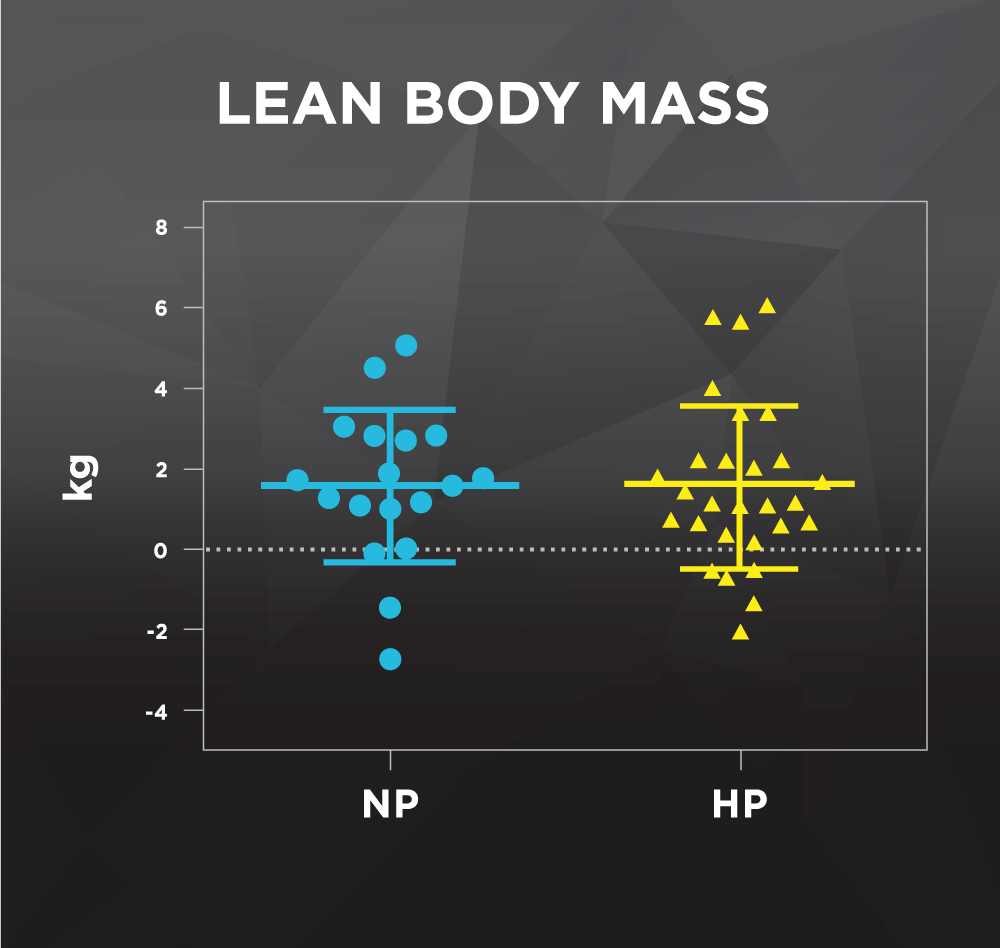
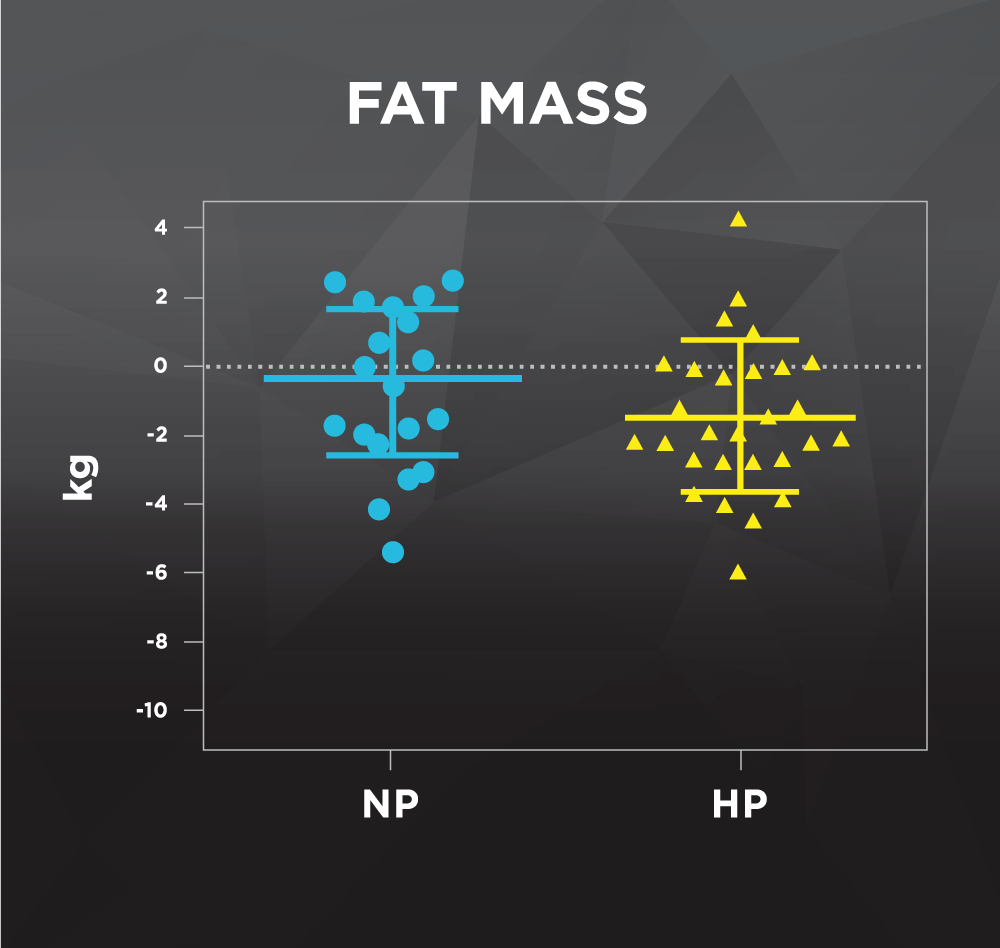
As with the previous study, the high protein group consumed more total calories per day and also witnessed significant decreases in fat mass (1.7 kg) compared to no change (0.3 kg) in the placebo group. Additionally, the normal protein group witnessed a 1.3 kg increase in bodyweight, whereas there was no total change (0.1kg) for the high protein group (although, considering they lost 1.7kg of fat, in theory they actually gained 1.6kg of lean mass).


Along with these findings, a less relevant but nevertheless interesting point is the individual data points for each participant. For lean body mass, some participants added 6kg of muscle, while others actually lost 2kg – that is a whopping 8kg difference between participants on exactly the same training plan and diet. For fat loss, which is obviously affected more by calorie intake, there is still a whopping 10kg difference between two of the participants.
So, while both studies find slight but still significant benefits from a higher protein diet, some may question the safety of this intake. Luckily, the researchers also monitored this and even conducted a full 1 year study verifying this.
Safety of a Super High Protein Diet
For years media outlets and internet gurus have stated the health issues of a high protein diet. While research is continually emerging to show this simply isn’t the case, a protein intake at around 5x the RDA is sure to cause further confusion.
Luckily, this area was covered by researchers, who monitored participants closely for 12 months where they consumed between 2.5 and 3.3 g/kg/bw of protein. Measuring a variety of metabolic and blood markers before and after, they found no negative impact on blood lipids, renal and hepatic function, as shown below
| Baseline | Normal | High | Reference Range | |
|---|---|---|---|---|
| Glucose mg/dL | 84 ± 11 | 87 ± 13 | 85 ± 9 | 65-99 |
| BUN mg/dL | 22 ± 6 | 22 ± 5 | 22 ± 4 | 7-25 |
| Creatinine mg/dL | 1.1 ± 0.2 | 1.1 ± 0.1 | 1.1 ± 0.2 | 0.60-1.35 |
| eGFR | 95 ± 19 | 101 ± 17 | 98 ± 16 | # |
| BUN/creatinine ratio | 20 ± 5 | 21 ± 5 | 20 ± 3 | 6-22 |
| Sodium mmol/L | 139 ± 2 | 139 ± 1 | 138 ± 1 | 135-146 |
| Potassium mmol/L | 4.3 ± 0.4 | 4.4 ± 0.3 | 4.3 ± 0.2 | 3.5-5.3 |
| Chloride mmol/L | 103 ± 1.7 | 102 ± 1.5 | 102 ± 1.7 | 98-110 |
| CO₂ mmol/L | 28 ± 2 | 28 ± 2 | 28 ± 2 | 19-30 |
| Calcium mg/dL | 9.6 ± 0.2 | 9.6 ± 0.2 | 9.7 ± 0.3 | 8.6-10.3 |
| Total protein g/dL | 7.2 ± 0.3 | 7.1 ± 0.4 | 7.1 ± 0.3 | 6.1-8.1 |
| Albumin g/dL | 4.6 ± 0.2 | 4.5 ± 0.2 | 4.5 ± 0.2 | 3.6-5.1 |
| Globulin g/dL | 2.5 ± 0.3 | 2.6 ± 0.3 | 2.6 ± 0.3 | 1.9-3.7 |
| Alb/Glob ratio | 1.8 ± 0.2 | 1.8 ± 0.2 | 1.8 ± 0.2 | 1.0-2.5 |
| Total Bili mg/dL | 0.7 ± 0.4 | 0.8 ± 0.6 | 0.7 ± 0.3 | 0.2-1.2 |
| Alkaline phosphatase U/L | 64 ± 17 | 67 ± 17 | 66 ± 16 | 40-115 |
| AST U/L | 28 ± 9 | 27 ± 6 | 31 ± 13 | 10-40 |
| ALT U/L | 28 ± 18 | 26 ± 8 | 31 ± 15 | 9-46 |
For cholesterol and markers of heart disease, they also found that this higher protein diet led to double the recommended dietary cholesterol intake 600 mg per day but did not negatively impact there blood lipid profiles (in fact, LDL and Cholesterol/HDL-c levels slightly improved).
| Baseline | Normal | High | Reference Range | |
|---|---|---|---|---|
| Total cholesterol mg/dL | 158 ± 28 | 146 ± 21 | 151 ± 26 | 125-200 |
| HDL-C mg/dL | 48 ± 15 | 48 ± 12 | 45 ± 11 | > or = 40 |
| TG mg/dL | 61 ± 18 | 62 ± 24 | 64 ± 18 | < 150 |
| LDL-C mg/dL | 98 ± 33 | 86 ± 18 | 92 ± 22 | < 130 |
| Cholesterol/HDL-C ratio | 3.9 ± 3.0 | 3.5 ± 1.6 | 3.5 ± 0.9 | < or = 5.0 |
The Benefits of a High Protein Diet
Although these findings only show slight improvements for the super high protein group, this is mainly because the control group (normal protein) is also very high, when compared to most people’s regular intake and in context of most other studies and the RDA.
When comparing these higher protein intakes (around 2 g/kg/bw or 1 g/lb/bw) there are dozens of studies and proven mechanisms that support the use of a higher protein intake [4][5][6][7][8][9].
Thermogenic
Protein is known as thermogenic, meaning the body takes more calories to breakdown the same amount of protein compared to carbs and fats. Per 100 calories, approximately 25-30% of those are lost during the metabolism of protein, compared to only around 5-10% for carbs and 1-3% for fat [10]. Although this may not seem significant, if individuals are consuming 1200 calories from protein per day (like in this study) it would equate to around a 300 calorie difference per day! [11].
Increased Satiety
Outside of tightly controlled research conditions, one of the biggest benefits that protein provides is its ability to reduce hunger and increase satiety. As any dieter knows, this can be a big limiting factor, especially after several weeks of dieting.
Protein helps reduce hunger via several mechanisms, including changes to hunger hormones such as ghrelin, controlling blood sugar levels and digestion and generally being based on low energy dense foods which contain large amounts of water such as meats and fish. Numerous studies have proven this when providing participants with an ab-libitum diet (no restrictions). In one study, when participants consumed 30% of their total intake from protein, they dropped their intake by over 400 calories per day! [12][13][14].
Changes in Hormones
As mentioned, protein can also alter key hormones that may affect hunger and satiety, including the hunger hormone ghrelin and GLP-1, peptide YY and cholecystokinin [15][16][17][18][19].
Helps Maintain Lean Mass and Add Muscle
Although it may not be a noticeable difference in the short term, protein will also increase the amount of muscle you can gain compared to a low protein diet, especially when combined with regular resistance training. Not only will this improve strength, aid other aspects of your training such as recovery and improve your physique, significantly more muscle will also slightly increase your metabolic rate and ability to partition and store nutrients, such as carbs/glycogen [20][21][22][23][24].
Improved Dietary Intake
One of the more overlooked benefits is that most high protein foods are also incredibly healthy. Therefore, simply by changing your dietary intake and eating more high protein foods, such as meat, fish, diary etc., you will not only be consuming more whole foods but also improving your health at the same time. These foods also tend to have a much lower energy density, healthy fats (such as fish) and micronutrients. One great example of this is a simple switch from children’s cereal for breakfast to eggs, which not only improves the protein content but also adds in healthy fats, and a bunch of micronutrients [25][26].
How Much Protein Do You Need?
The short answer is of course, ‘it depends’. For most people, researchers have started to suggest around 1.4 – 2.0 g/kg/bw is a good ballpark figure, which will easily cover one’s daily protein needs and provide additional protein for those participating in sport or exercise [27][28].
Of course, a higher protein intake beyond this may be beneficial for some individuals and in specific cases. As shown in these studies, a super high protein intake may also be a good choice for those looking to lean bulk, or, in specific situations when you are trying to increase calories without gaining excess fat, such as post competition or during a reverse diet.
When dieting, some individuals may also benefit from a higher protein intake, simply to provide more low energy dense foods and maximize satiety. For example, large amounts of meat/fish and vegetables can help keep you full, while providing plenty of nutrients and only a small amount of calories per plate-sized serving [29][30][31].
In summary, aim for around 0.7 – 1.0 g/lb/bw of protein per day, ideally made up of high quality proteins, high in essential amino acids, such as meat and fish. Additionally, this daily intake would ideally be distributed fairly evenly, or, at least spread out over 3-4 meals rather than consumed in 1 sitting. Finally, as we all know, protein around the workout (before/after) can also enhance the training adaptations and recovery [32].
If you are interested in adding more protein, these studies show you can do so in a safe and effective manner, possibly even helping you to drop body fat or add more lean mass, especially if your current intake is below 1 g/lb/bw.
References
- https://www.ncbi.nlm.nih.gov/pubmed/24834017
- https://jissn.biomedcentral.com/articles/10.1186/s12970-015-0100-0
- https://www.hindawi.com/journals/jnme/2016/9104792/ref/
- http://ajcn.nutrition.org/content/82/1/41.abstract
- https://www.ncbi.nlm.nih.gov/pubmed/21102327
- https://www.ncbi.nlm.nih.gov/pubmed/20711407
- http://ajcn.nutrition.org/content/81/6/1298.short
- http://ajcn.nutrition.org/content/81/6/1298.short
- http://www.nature.com/ijo/journal/v28/n1/abs/0802461a.html
- https://www.ncbi.nlm.nih.gov/pmc/articles/PMC524030/
- http://ajcn.nutrition.org/content/42/2/177.short
- http://ajcn.nutrition.org/content/82/1/41.abstract
- http://ajcn.nutrition.org/content/82/1/41.abstract
- http://www.nature.com/ijo/journal/v33/n3/abs/ijo2008278a.html
- http://www.ncbi.nlm.nih.gov/pubmed/16400055/
- http://www.sciencedirect.com/science/article/pii/S1550413106002713
- http://press.endocrine.org/doi/abs/10.1210/jc.2009-0949
- http://www.ncbi.nlm.nih.gov/pubmed/22188045
- http://www.ncbi.nlm.nih.gov/pubmed/16469977
- http://www.ncbi.nlm.nih.gov/pubmed/19927027/
- http://www.fasebj.org/content/28/1_Supplement/371.5
- http://www.ncbi.nlm.nih.gov/pubmed/16046715/
- http://www.ncbi.nlm.nih.gov/pubmed/12566476/
- http://www.ncbi.nlm.nih.gov/pubmed/23446962
- http://ajcn.nutrition.org/content/61/6/1402S.short
- http://www.nutritionj.com/content/9/1/10
- https://www.ncbi.nlm.nih.gov/pubmed/17908291
- https://www.ncbi.nlm.nih.gov/pubmed/15212752
- https://www.ncbi.nlm.nih.gov/pubmed/19927027
- https://www.ncbi.nlm.nih.gov/pubmed/17229942
- https://www.ncbi.nlm.nih.gov/pubmed/14649369
- https://jissn.biomedcentral.com/articles/10.1186/1550-2783-4-8

